
Before Twitter introduced its own analytics tool, checking the effectiveness of your tweets was tougher to figure out. You had to rely on stats from third party sites. Some of these stats were good, some were sketchy, some were free and some sites charged a hefty fee. Now, small businesses can get all the information they need (in our opinion) straight from the source.
If you have a Twitter account, then you have access to analytics. Log into your account and then open up a new browser tab and go to https://analytics.twitter.com. You’ll be automatically directed to the analytics of your profile (but note that the recording of your stats may not start until you access URL, unless you have already set up a Twitter ads account). Once you’re in, you’ll see your Tweet Activity first. On this screen, your recent tweets are listed as well as Impressions, Engagement and Engagement Rate.
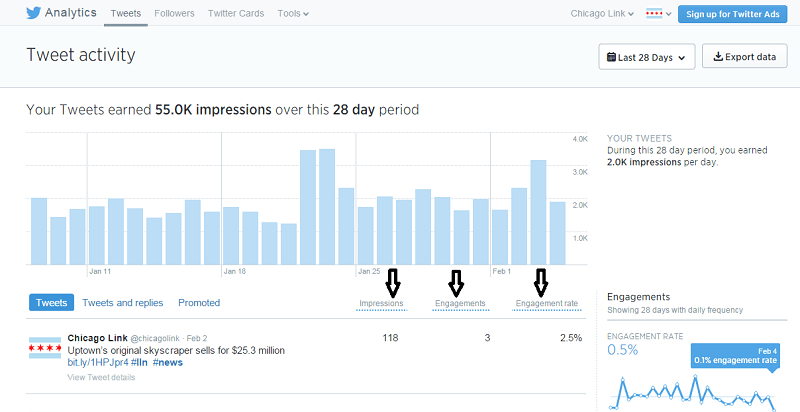
Impressions is defined by Twitter as the number of times users saw the tweet on Twitter. Engagement is defined as the total number of times a user has interacted with a tweet. This includes all clicks on any link in a tweet, including hashtag, link, avatar, username, retweets, followers, favorites, everything. The Engagement Rate is the number of engagements divided by the total number of impressions.
The default time period is the last 28 days, but you can go back 13 months (if Twitter has been recording your stats, that is) by selecting specific dates. The only issue is that you can only see about 3 months at a time.
Once you’ve selected the time period you want, you might want to export the data to a spreadsheet by clicking on the Export Data button on the top right. If you want the entire past year, you will have to select 3 months’ worth of data at a time and export each time period. Then you can make a master spreadsheet and paste in all of the data from each time period (a process that can be annoying).
Once you have a master spreadsheet of data, you can see the best days/times to tweet to reach the most people, the types of tweets that get the most engagement from your audience and how many engagements your account has gotten in the past year. Note that you’ll need to have tweeted consistently to get decent data. If you haven’t been tweeting consistently (daily, and preferably multiple times per day), now is the time to start!
On your screen, you can do a visual scan of your most recent tweets to see which ones are getting the most Engagement. This is especially helpful if you want to see what variance of text seems to grab people’s attention the most. Or, on your spreadsheet, highlight the Engagements column and sort it so that the tweets with the highest number of engagements is on the top. You can easily see which tweets have been getting the most Engagement.
It may be disheartening to see how little engagement your tweets are actually getting (unless you’re a celebrity or have a hugely popular brand). Twitter is a fast-paced environment, so your stats will probably underscore the need to increase the number of your tweets as well as study what language drives people to click on your link, reply to you, retweet you, etc.
Have you checked out Twitter’s Analytics yet?